Introduction to FTA analysis – technical information necessary to perform the analysis
FTA, or Fault Tree Analysis, is a deductive method for examining the causes of failures. The starting point is always a specific event – the failure we want to prevent. From that point, we go deeper, breaking the problem into smaller elements and checking what exactly must happen for the failure to occur.
Fault Tree Analysis
FTA is a great tool for understanding how and why a system can fail (or why it has already failed, but let’s focus on proactive use). The topic is broad enough that fitting everything into a single article would be impractical. To avoid overwhelming you with everything at once, the content is divided into several smaller articles, each guiding you step by step through different parts of the method. This makes it easier to get into the topic and immediately apply the theory in practice.
Links to new parts will appear below as soon as they are published.
- Introduction to FTA analysis – technical information necessary to perform the analysis
What is FTA?
Let’s get straight to the point: what is FTA? FTA, or Fault Tree Analysis, is a deductive method for examining the causes of failures. The starting point is always a specific event – the failure we want to prevent. From there, we go deeper, breaking the problem into smaller pieces and checking what exactly must happen for the failure to occur. It works a bit like an investigation by Sherlock Holmes. We start from the effect and follow the path toward the cause, eliminating randomness and gradually reaching the root cause. Thanks to this approach, FTA turns the apparent chaos of a failure into a clear map of what truly causes the problem.
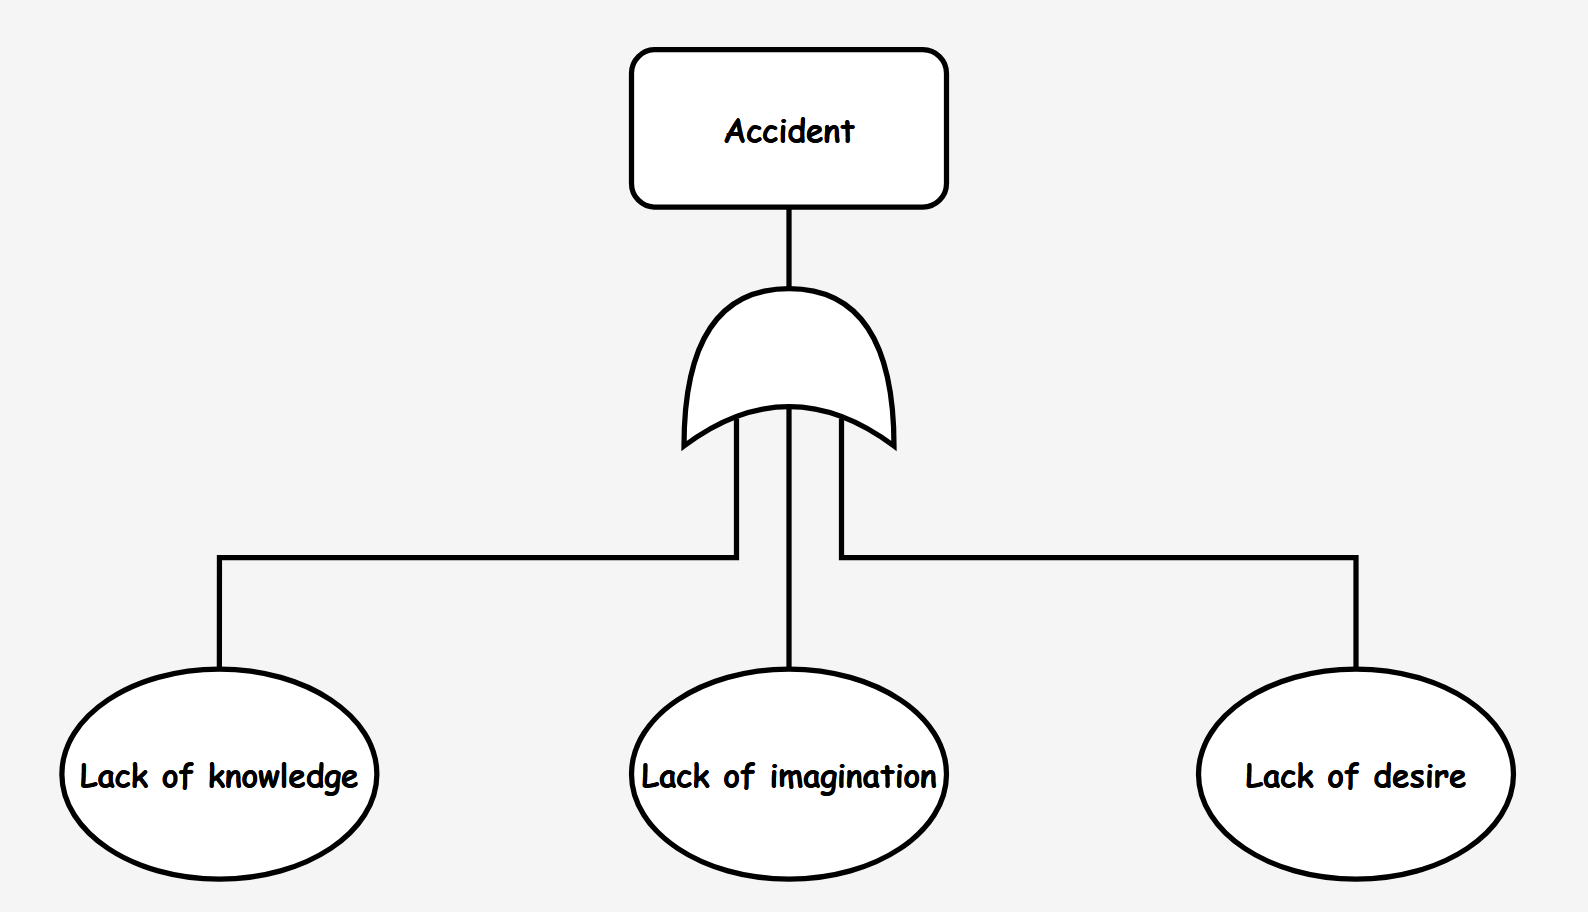
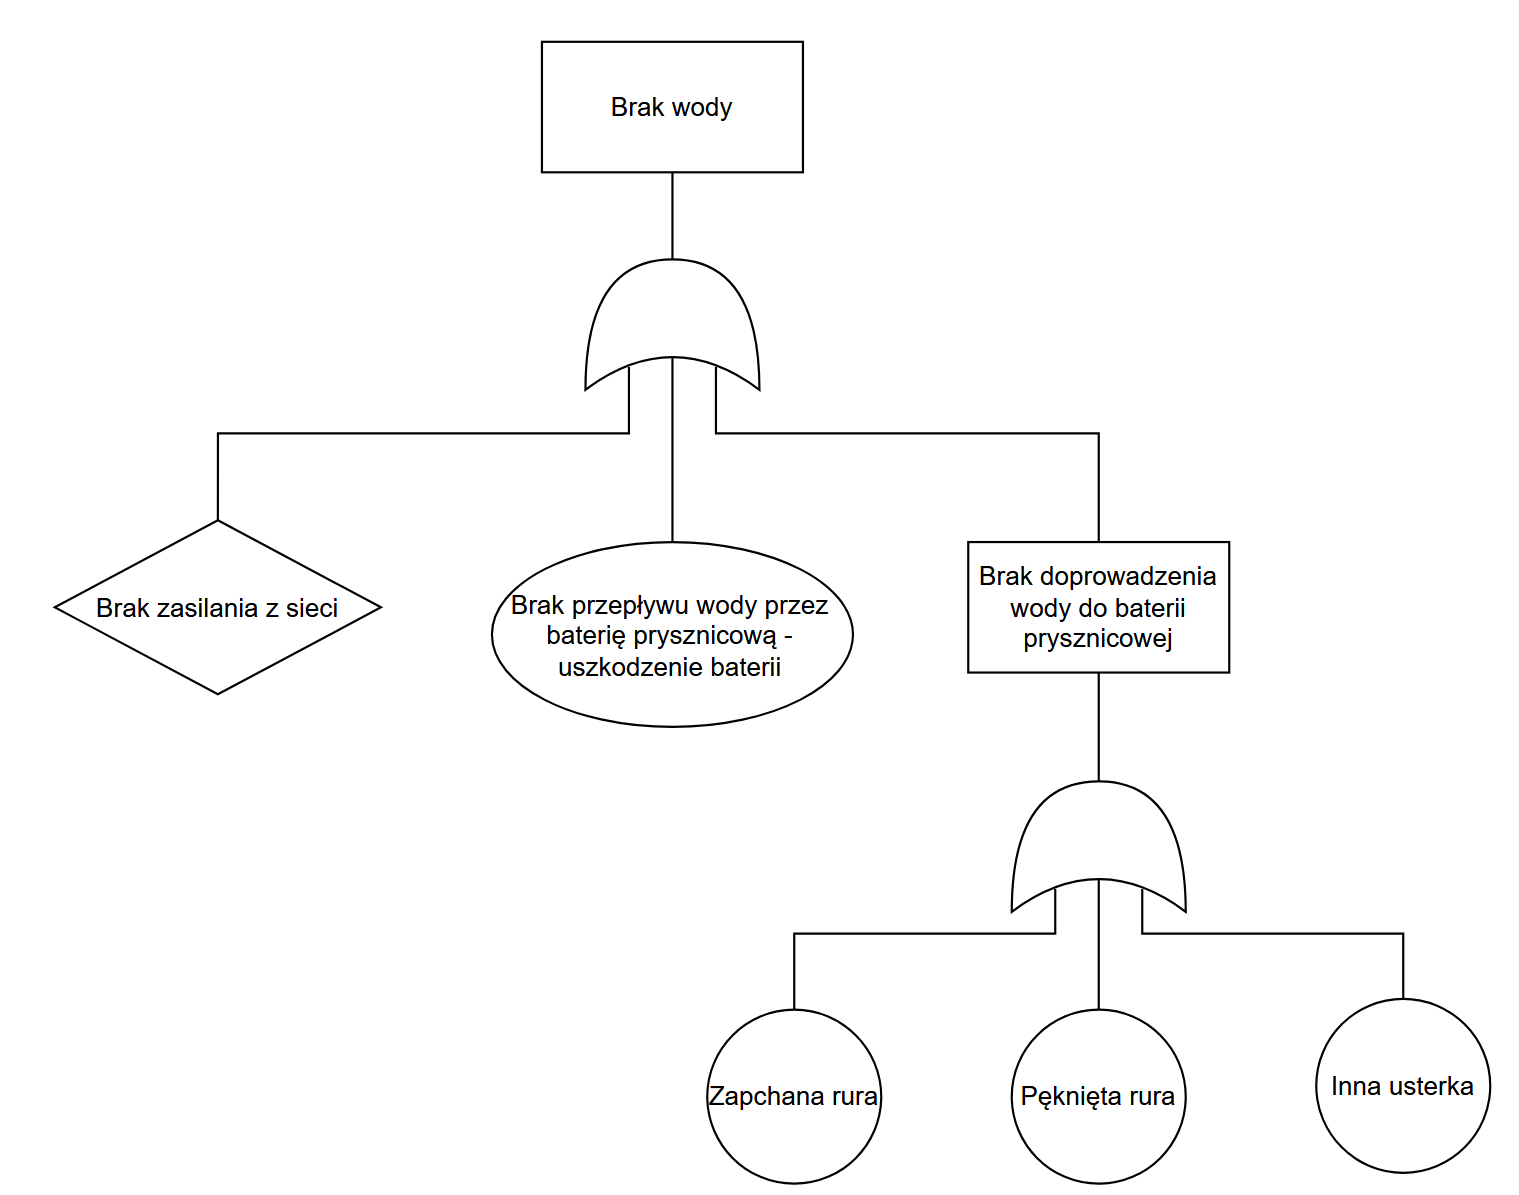
Let’s show this with a simple example of a failure many of us have experienced. You come home in the evening, want to take a shower, turn on the water and nothing happens. A plumber could guess blindly, but could also approach it methodically. In his mind, something resembling an FTA appears. The top event is no water. So we ask: why is there no water? Three possible causes: no supply from the main line, no water reaching the shower, or no flow through the shower faucet itself.
At this point you can start testing each branch. If water flows from the sink, the supply is fine. You can then remove the shower faucet and check whether water even reaches it. If it doesn’t, we go deeper: the pipe might be cracked, clogged, or another fault occurred. Step by step, we reach the source of the problem.
Everyone has done such an analysis at some point, just without calling it that. It’s one thing to solve a failure in practice, but quite another to clearly present the entire reasoning. It’s easy to see how clumsy verbal descriptions can get, and in more complex systems it becomes even harder. That’s why the graphical form used in FTA is so helpful.
Types of FTA analysis
In FTA you can follow two paths, and both make sense, though each serves a different purpose. The first is the qualitative approach. The goal here is to understand how a failure can occur and what combinations of events lead to it. We don’t deal with numbers, just logical dependencies. This works well when we want to find weak points in the system, decide where to add redundancy, or determine which components require more control.
Quantitative FTA analysis is a different story. Here the focus is on the probability of a failure and how often basic events may occur. To do this, you need reliability data, knowledge of how the components work, and someone who can translate this into final risk numbers. The result is more concrete: we get actual risk metrics, probabilities, and can check whether the system meets standards such as SIL (IEC 61508).
Both forms complement each other well. One focuses on systematic errors and understanding what can go wrong, while the other focuses on random errors and answers how often a failure may occur. I mentioned this earlier in the article about random and systematic failures. Combining both approaches gives a picture that helps make sound design decisions instead of guessing.
Basic symbols used in an FTA tree
To work with FTA at all, you need to know the symbols defined in IEC 61025. Without them, the tree looks like a random set of shapes instead of a logical failure model.
Logic gates
AND Gate
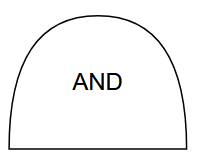
This is one of the basic gates. It represents a situation in which all input events must occur to produce the output event. In simpler terms: the AND gate shows a case where a single failure is not enough to cause trouble. It’s a technical way of expressing redundancy or protection. Only when multiple elements fail simultaneously does the top event become possible.
The industrial robot example fits perfectly here. If we analyze the event: a person being hit by a robot, then under an AND gate you could place these three events:
- Lack of human detection in the robot's working zone.
- No barrier preventing access to the robot’s operating zone.
- Uncontrolled robot movement.
Each of these events alone does not necessarily lead to an accident. If a person is detected upon entering the zone and the robot doesn’t make an uncontrolled move, nothing happens. But when all of them occur together, the top event becomes real. That’s exactly what AND expresses: a combination of simultaneous unwanted events creating a real hazard.
OR Gate
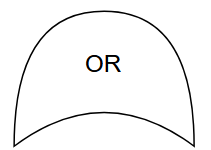
Now that we have AND, naturally we move to OR. Continuing the robot example, one earlier point mentioned the protective barrier. Let’s zoom in on that event: missing barrier. The OR gate works perfectly here because it represents a situation where several different causes can lead to the same effect. It takes only one event for the barrier to fail its function.
For the event “lack of barrier protecting access,” possible causes under OR might include:
- physical damage to the barrier, such as broken posts or a detached anchor,
- no barrier installed at all,
- incorrect functioning of the logical system responsible for detecting the presence or status of the barrier (e.g., bad configuration or incorrect logic in the controller).
Each of these events is different, but all lead to the same result: uncontrolled access to the robot area. OR shows this clearly by emphasising that a single cause is enough for protection to fail.
XOR Gate
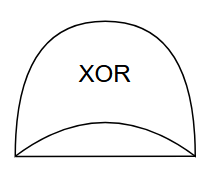
It appears less often but is useful. It represents a case in which exactly one of the input events leads to the output event, but not any combination of them. We use it when the effect depends on one specific cause from a group of alternatives.
Priority AND (PAND)
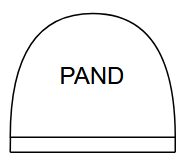
This is an AND gate with an added requirement of sequence. The events must happen in a specific order for the output event to occur. It is used where sequence matters, such as in dynamic processes.
Voting Gate
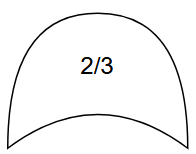
A voting gate in FTA activates the output event only when a defined number of input events occur simultaneously. Not all inputs must fail, only a minimum required number. This makes it possible to model systems that tolerate some faults but fail once the threshold is exceeded.
Inhibit Gate
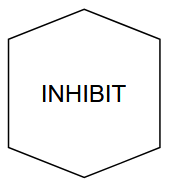
It works like an AND gate but with an added condition symbol. It is read as: the output event occurs only when the input event and the condition are both met. It is used when a failure can happen only under specific circumstances.
Transfer Symbol
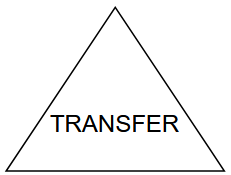
This symbol is used when the tree becomes too large. It allows moving a part of the analysis elsewhere in the document. This prevents the creation of huge, unreadable diagrams.
Events
Basic Event
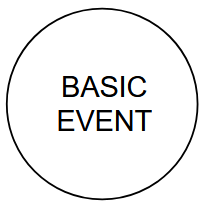
A basic event is a single, elementary cause of failure that cannot be broken down further. In a fault tree, it forms the end point of the analysis. It represents a specific failure or defect that can occur independently, such as a damaged component, blockage, open circuit, or any simple mechanism leading to failure. Basic events define the set of potential direct causes leading to the top event.
Intermediate Event
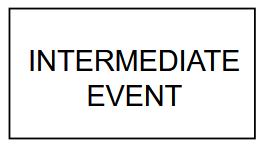
It describes a state arising from the combination of lower-level causes. It is not the final failure but the next step in the logical structure. It appears as the output of a gate.
Undeveloped Event
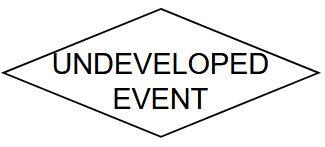
This marks a potential cause that we do not develop further because data is insufficient or its role in the analysis is marginal. It is used carefully to avoid pretending we know more than we do. An example may be a mechanical failure that is outside the scope of a functional safety analysis.
Summary
FTA helps structure the process of identifying failure causes and present it in a clear graphical form. It makes it easier to understand how different system elements influence the top event. Whether the analysis is qualitative or quantitative, its goal is to identify weak points and support informed preventive decisions. The symbols and structure discussed above form the basis for further learning and applying the method in more complex cases.